
Power BI Roadmap for Beginners: Step-by-Step Guide
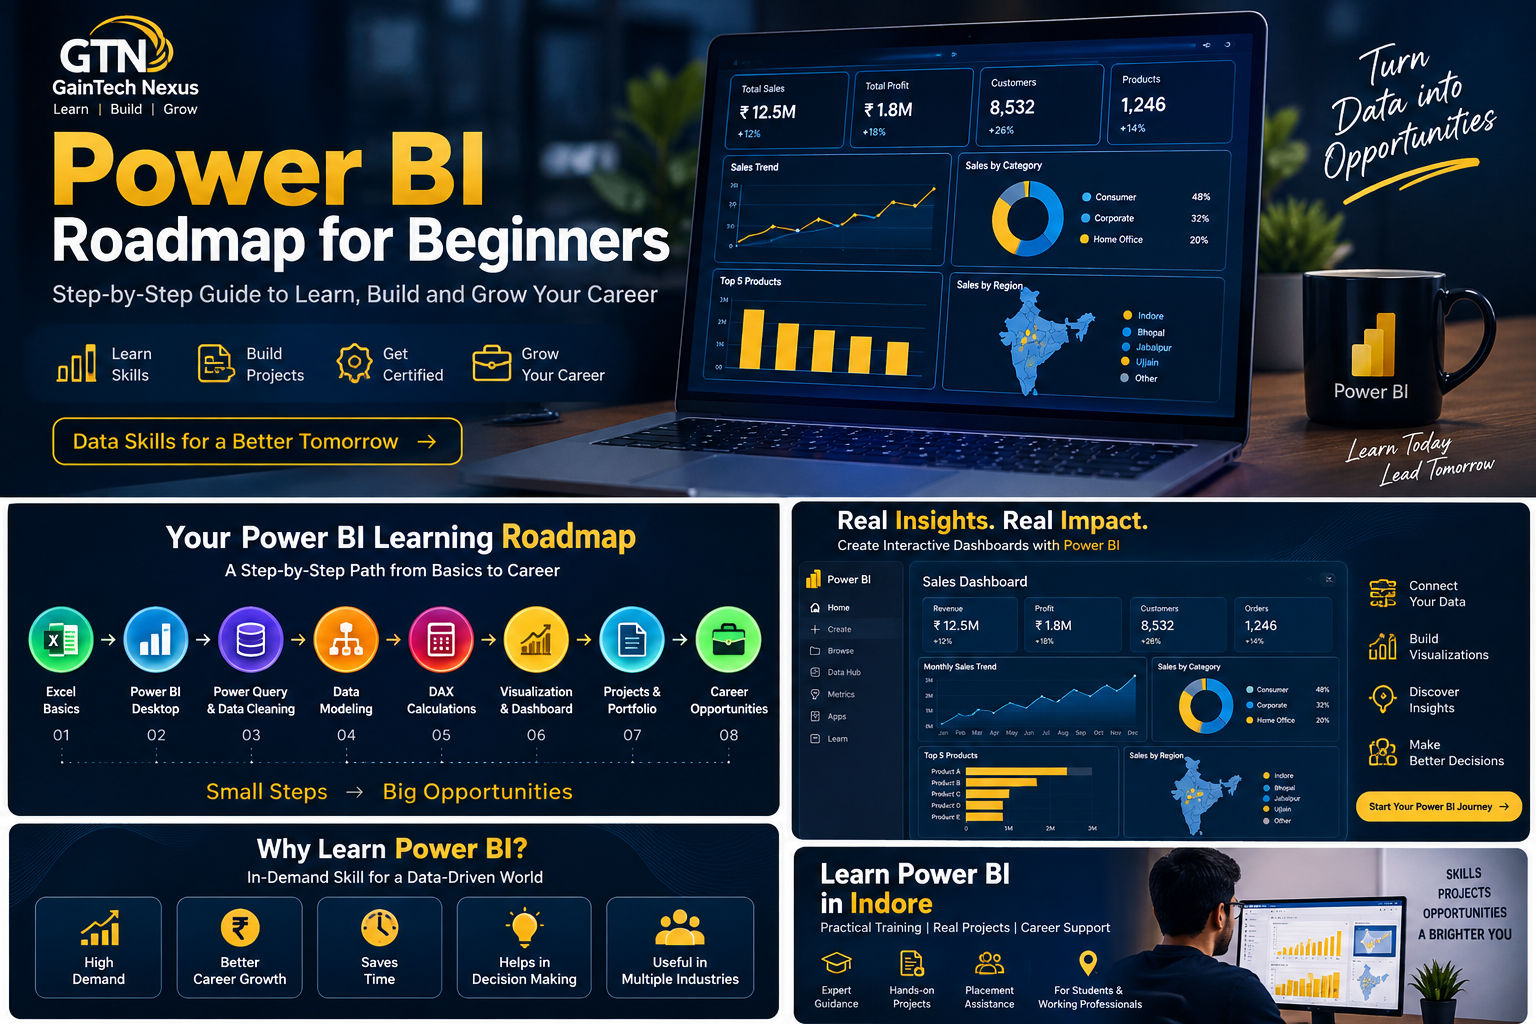
Power BI has become an important tool for data analysis, business intelligence and interactive reporting. For a beginner, however, it can be difficult to understand where to start and what to learn first.
Should you learn Excel before Power BI?
When should you learn Power Query?
How important is DAX?
Do you need SQL?
What kind of Power BI projects should you build?
This Power BI roadmap for beginners answers these questions and provides a step-by-step learning path from the basics to advanced reporting and dashboard development.
For students and working professionals in Indore, following a structured roadmap can help turn Power BI from a dashboard-building tool into a practical data analytics skill.
What Is Power BI?
Power BI is Microsoft's business intelligence and data analytics platform used to connect to data, prepare and transform it, build data models, create interactive reports and communicate insights.
Power BI can work with data from sources such as:
- Excel
- CSV files
- SQL databases
- Relational databases
- Online services
- Other supported data sources
The typical Power BI workflow is:
Microsoft's beginner learning material similarly covers connecting to data, transforming data, modeling and creating interactive reports. (Microsoft Learn)
Power BI Roadmap for Beginners
A practical Power BI learning roadmap can be divided into these stages:
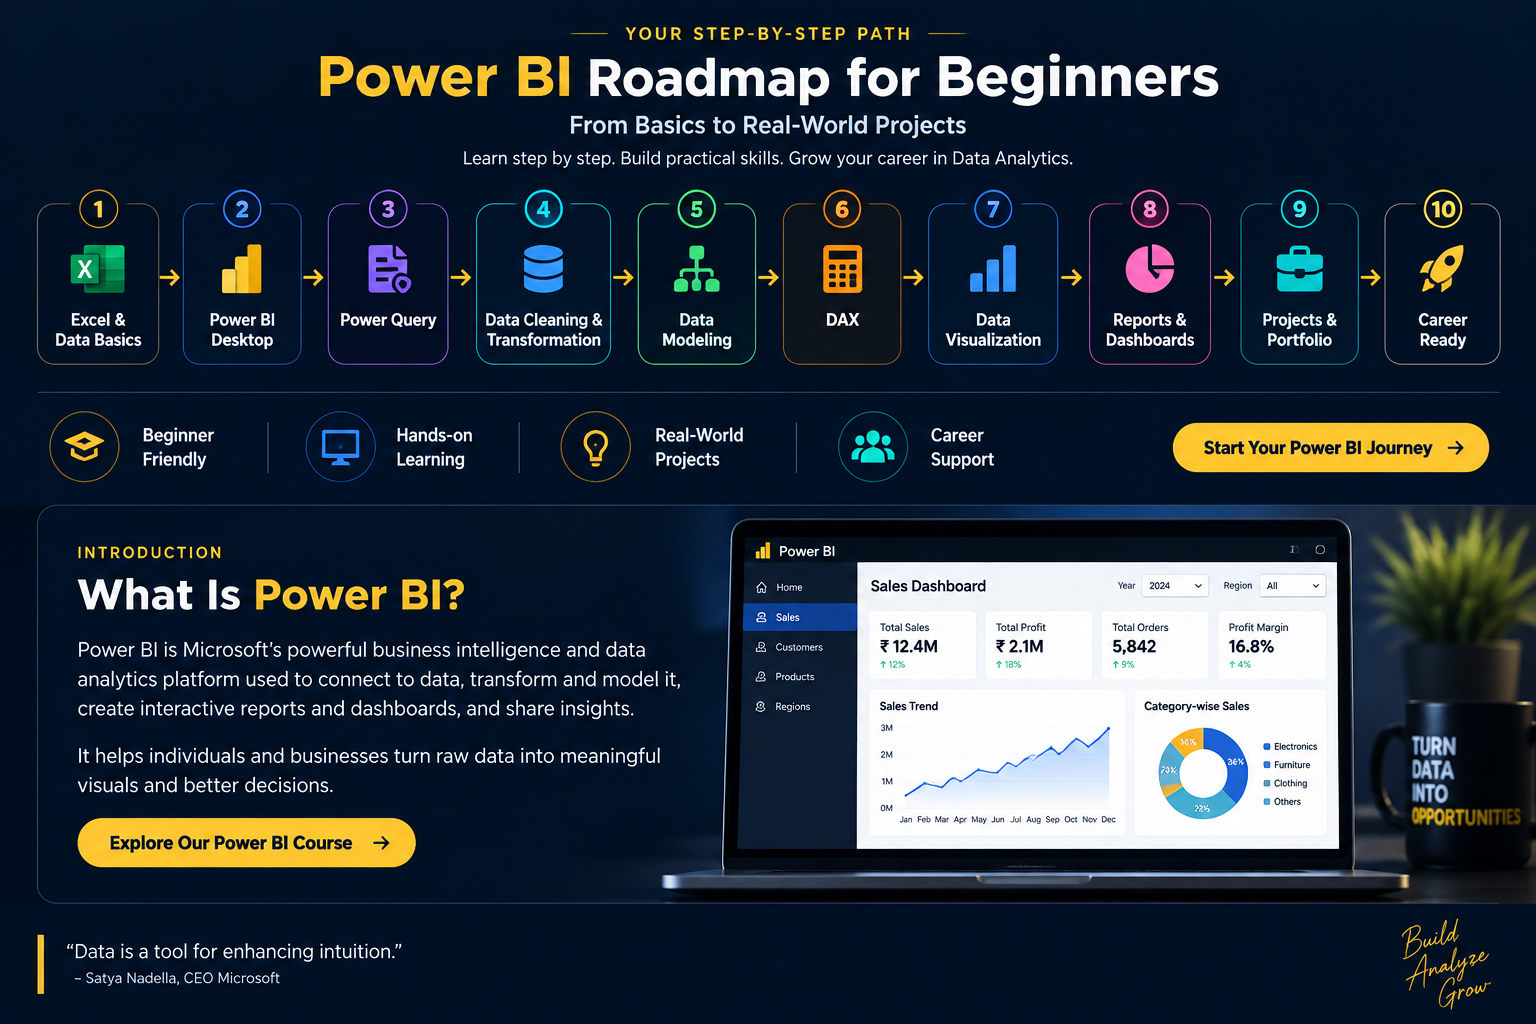
Let's understand each stage.
1. Learn the Basics of Data Analysis
Before starting advanced Power BI, understand some basic data concepts.
You should know:
- Rows and columns
- Tables
- Data types
- Categories
- Measures
- Aggregations
- Filters
- Sorting
- Basic calculations
- KPIs
- Business metrics
You don't need advanced programming knowledge to start learning Power BI.
However, understanding how business data works will make Power BI much easier to learn.
2. Learn Excel Fundamentals
Excel and Power BI are closely related in many data-analysis workflows.
If you are a complete beginner, learn basic Excel concepts such as:
- Tables
- Sorting and filtering
- Basic formulas
- IF functions
- SUM and AVERAGE
- COUNT and COUNTIF
- VLOOKUP/XLOOKUP
- Pivot Tables
- Charts
- Conditional formatting
You don't need to become an Excel expert before starting Power BI.
The goal is to understand how tabular data works.
3. Learn Power BI Desktop
Once you understand basic data concepts, start with Power BI Desktop.
Learn the Power BI interface and understand the difference between:
- Data view
- Model view
- Report view
Then learn how to:
- Import data
- Select tables
- View columns
- Create basic visuals
- Add filters
- Create report pages
- Save Power BI files
Microsoft's beginner Power BI material includes getting started with Power BI Desktop, importing data and creating reports. (Microsoft Learn)
4. Learn Power Query
Power Query is one of the most important skills for a Power BI beginner.
It is used to connect, clean, transform and prepare data before analysis.
Microsoft's Power BI learning path specifically covers getting data from files and databases and using Power Query to clean and transform data. (Microsoft Learn)
Important Power Query topics:
- Importing data
- Changing data types
- Removing columns
- Renaming columns
- Removing duplicates
- Handling missing values
- Splitting columns
- Merging columns
- Replacing values
- Filtering rows
- Sorting data
- Grouping data
- Merge Queries
- Append Queries
- Pivot columns
- Unpivot columns
For example, imagine you receive a sales dataset containing:
Customer Name
Product
Date
Quantity
Sales
Region
Before creating a dashboard, you may need to clean incorrect values, change data types, remove duplicates and restructure the data.
That is where Power Query becomes important.
5. Learn Data Cleaning and Transformation
A dashboard is only as useful as the data behind it.
Therefore, don't jump directly into charts.
Learn how to identify and solve common data problems:
- Missing values
- Duplicate records
- Incorrect data types
- Inconsistent names
- Blank rows
- Incorrect dates
- Unwanted columns
- Formatting problems
- Incorrect categories
A good Power BI workflow usually prepares the data before building the report.
6. Learn Data Modeling
After cleaning the data, the next major step is data modeling.
Data modeling is important when your report contains multiple tables.
For example:
Customers
     |
     |
Sales -------- Products
     |
     |
Calendar
You need to understand how these tables relate to each other.
Learn:
- Relationships
- Primary keys
- Foreign keys
- One-to-many relationships
- Many-to-many relationships
- Fact tables
- Dimension tables
- Star schema
- Date tables
- Cardinality
Microsoft's Power BI modeling guidance includes configuring relationships, tables, columns, hierarchies and measures as part of the semantic model. (Microsoft Learn)
A good data model can make your reports easier to analyze and your calculations easier to manage.
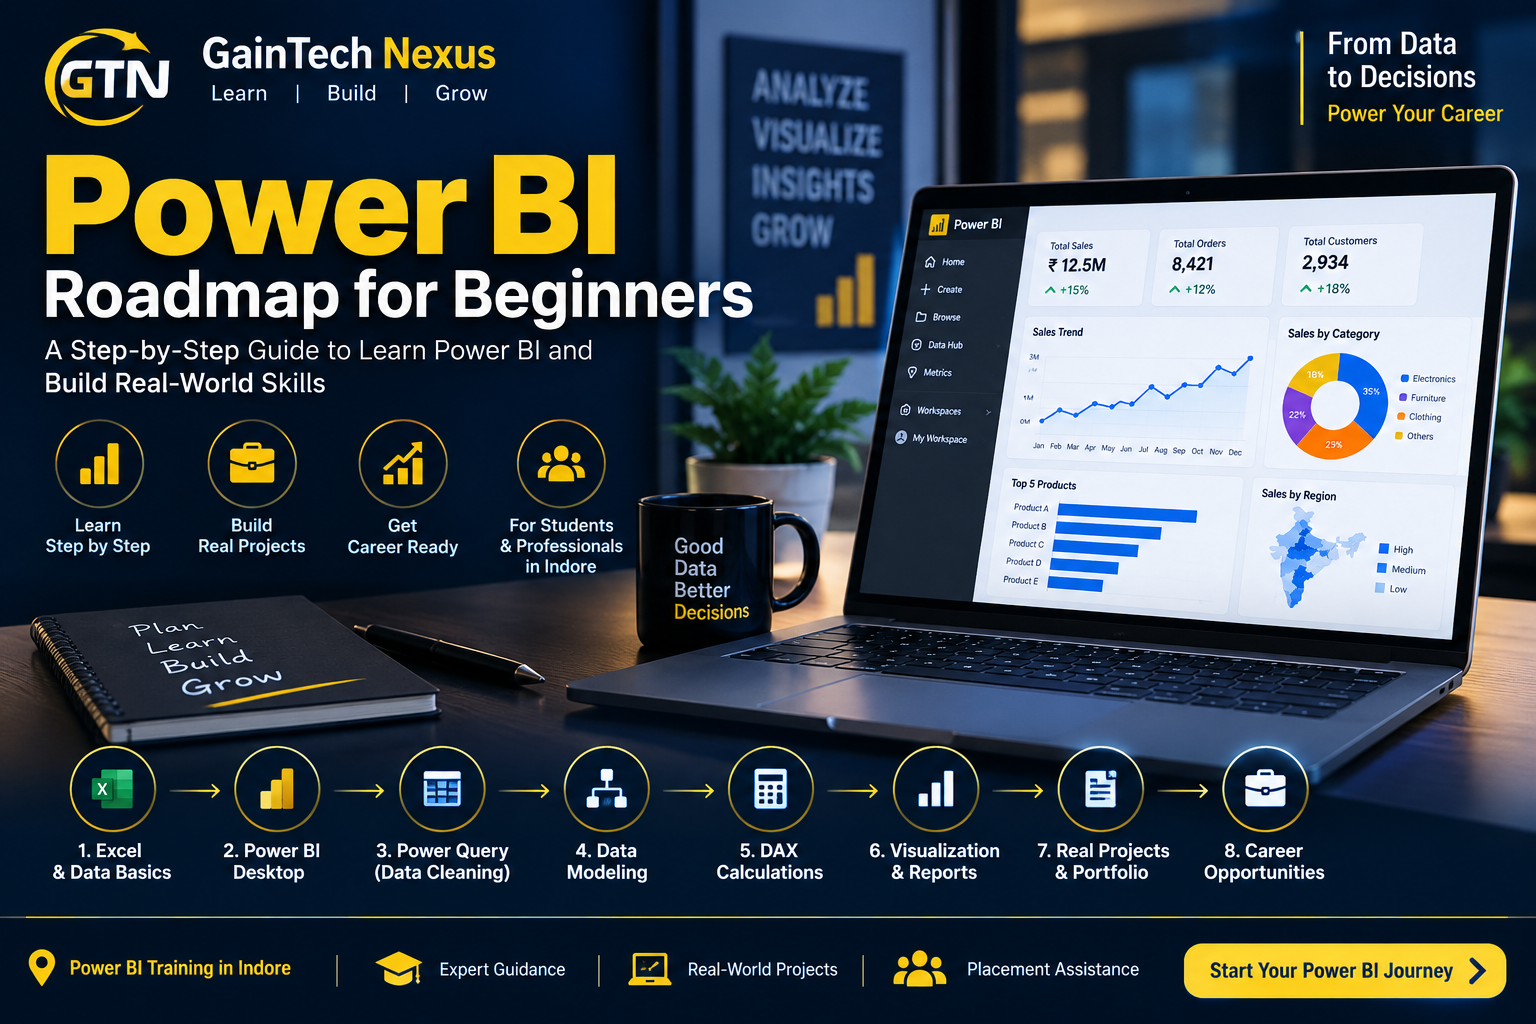
7. Learn DAX
After understanding data modeling, start learning DAX — Data Analysis Expressions.
DAX is the formula language used in Power BI for creating calculations and measures. Microsoft describes DAX as a formula language that enables calculations and adds logic to data models. (Microsoft Learn)
Start with basic DAX:
SUM()
AVERAGE()
COUNT()
COUNTROWS()
DISTINCTCOUNT()
MIN()
MAX()
Then learn:
CALCULATE()
FILTER()
ALL()
ALLEXCEPT()
VALUES()
And gradually move into:
- Measures
- Calculated columns
- Calculated tables
- Filter context
- Row context
- Time intelligence
- Variables
- Iterator functions
Example
A simple sales measure:
Total Sales = SUM(Sales[SalesAmount])A customer count:
Total Customers = DISTINCTCOUNT(Sales[CustomerID])DAX becomes particularly important when you want to create dynamic business calculations rather than just display raw columns. Microsoft provides dedicated learning paths covering DAX formulas, measures, calculated columns, filter context and time intelligence. (Microsoft Learn)
8. Learn Power BI Visualizations
Now you can start designing meaningful reports.
Learn how to use:
- Bar charts
- Column charts
- Line charts
- Pie and donut charts
- Tables
- Matrix
- Cards
- KPI visuals
- Maps
- Slicers
- Waterfall charts
- Funnel charts
- Scatter plots
But don't add visuals just because they look attractive.
Every visual should answer a business question.
For example:
Which product generates the highest revenue?
Which region has the highest sales?
How are sales changing month by month?
Which customers contribute the most revenue?
What is the profit margin?

9. Learn Dashboard Design
A Power BI dashboard should communicate information quickly and clearly.
Learn:
- Page layout
- Visual hierarchy
- Consistent formatting
- Slicers
- Filters
- Drill-through
- Tooltips
- Bookmarks
- Navigation buttons
- Conditional formatting
- KPI cards
A good dashboard should allow the user to move from:
Microsoft describes dashboards as a way to monitor important business metrics at a glance, while reports provide more detailed analysis. (Microsoft Learn)
10. Learn Advanced Power BI Features
Once you understand the fundamentals, move toward advanced features.
Important topics include:
- Advanced DAX
- Time intelligence
- Drill-through
- Bookmarks
- Tooltips
- What-if parameters
- Field parameters
- Row-level security
- Dynamic titles
- Advanced data modeling
- Performance optimization
Don't try to learn all of these during your first week.
Build a strong foundation first.
11. Learn Power BI Service
Power BI is not limited to Power BI Desktop.
You should also understand the Power BI Service.
Learn about:
- Workspaces
- Reports
- Dashboards
- Semantic models
- Publishing
- Sharing
- Refresh
- Apps
- Permissions
Microsoft's documentation distinguishes Power BI Desktop from the Power BI Service and provides separate guidance for creating, publishing, sharing and consuming reports. (Microsoft Learn)
12. Learn SQL Alongside Power BI
If your goal is Data Analytics, learning SQL alongside Power BI is highly useful.
Start with:
- SELECT
- WHERE
- GROUP BY
- ORDER BY
- JOIN
- CASE
- Subqueries
- CTEs
- Window functions
Why?
Because business data may come from databases rather than Excel files.
Understanding SQL helps you understand where the data comes from and how it can be queried before it reaches the reporting layer.
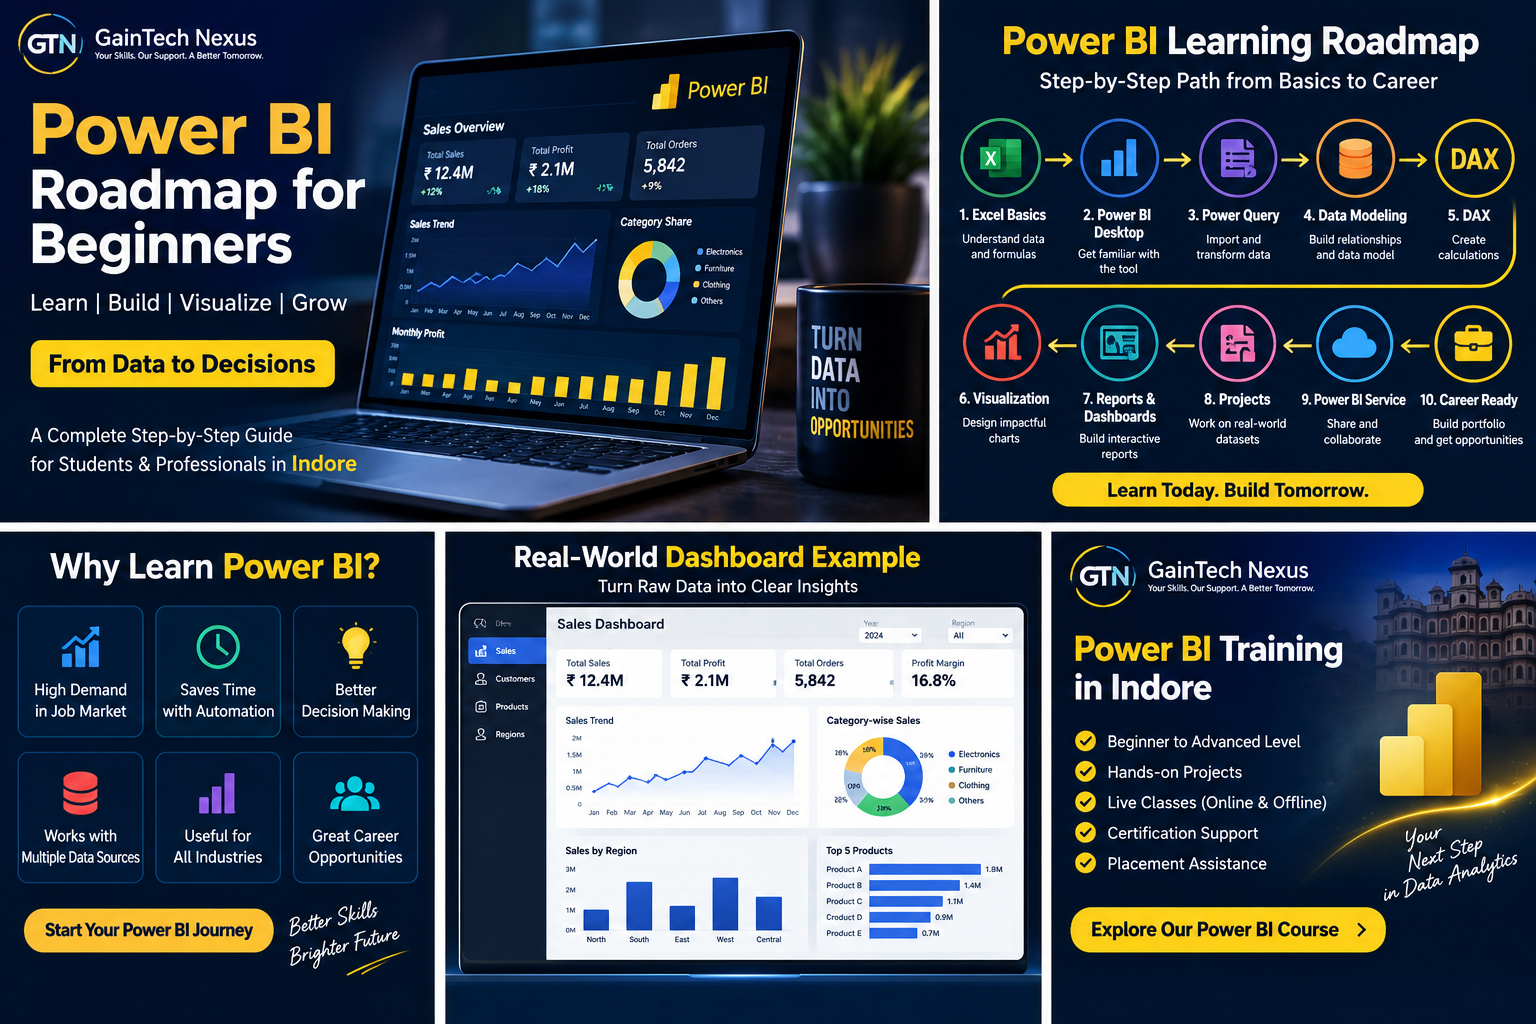
13. Build Real Power BI Projects
This is one of the most important parts of the roadmap.
Don't stop after watching Power BI tutorials.
Build dashboards.
Beginner Power BI project ideas:
#### Sales Dashboard
Analyze:
- Revenue
- Quantity
- Products
- Regions
- Monthly sales
- Customer performance
#### HR Dashboard
Analyze:
- Employee count
- Attrition
- Department
- Gender
- Experience
- Salary
#### Finance Dashboard
Analyze:
- Revenue
- Expenses
- Profit
- Budget
- Variance
#### Marketing Dashboard
Analyze:
- Leads
- Campaign performance
- Conversion
- Cost
- ROI
#### Supply Chain Dashboard
Analyze:
- Orders
- Inventory
- Delivery
- Suppliers
- Product performance
14. Create a Power BI Portfolio
After completing projects, create a portfolio.
Your portfolio can include:
- Power BI dashboards
- Project screenshots
- Business questions
- Data-cleaning steps
- Data model
- DAX measures
- Key insights
- Recommendations
For each project, explain:
This is much more useful than simply saying:
“I know Power BI.”
You can demonstrate what you actually built.
15. Prepare for Power BI Interviews
Once you have learned Power BI and completed projects, start preparing for interviews.
Common areas include:
Power Query
- What is Power Query?
- Merge vs Append
- Query transformations
- Data types
Data Modeling
- Relationships
- Cardinality
- Star schema
- Fact vs dimension tables
DAX
- Measure vs calculated column
- CALCULATE
- FILTER
- SUMX
- ALL
- RELATED
- Time intelligence
Visualization
- Choosing the right chart
- Dashboard design
- Filters
- Drill-through
- Bookmarks
Projects
Be prepared to explain your own dashboard from beginning to end.
Power BI Roadmap for Students in Indore
If you are a student in Indore and want to learn Power BI for Data Analytics, you don't need to learn every feature at once.
A practical progression is:
Stage 1 — Foundation
Stage 2 — Data Preparation
Stage 3 — Data Modeling
Stage 4 — Calculations
Stage 5 — Reporting
Stage 6 — Advanced Skills
Stage 7 — Career
This gives students in Indore a structured path from Power BI beginner to practical Data Analyst skills.
Power BI Roadmap: Skills You Should Learn
| StageSkills | |
|---|---|
| Foundation | Excel, Data Basics |
| Power BI Basics | Power BI Desktop |
| Data Preparation | Power Query |
| Data Cleaning | Transformation, Data Types, Missing Data |
| Data Modeling | Relationships, Star Schema |
| Calculations | DAX, Measures |
| Visualization | Charts, KPIs, Slicers |
| Reporting | Interactive Reports |
| Advanced | Time Intelligence, Drill-through, Bookmarks |
| Service | Workspaces, Publishing, Sharing |
| Career | Projects, Portfolio, Interviews |
How Long Does It Take to Learn Power BI?
There is no single fixed timeline because it depends on your previous experience and the amount of practice you do.
A beginner should focus on progressive learning rather than trying to finish everything quickly.
A practical learning sequence is:
The most important part is regular hands-on practice.
Common Mistakes Power BI Beginners Make
1. Learning only charts
Power BI is much more than creating attractive charts.
You need to understand data preparation, modeling and calculations.
2. Ignoring Power Query
Cleaning and transforming data is an important part of the Power BI workflow.
3. Avoiding DAX
Basic visuals may work without much DAX, but more advanced analysis often requires calculated measures and logic.
4. Creating dashboards without a business question
A dashboard should communicate useful information, not just display many visuals.
5. Not building projects
Projects help you apply Power Query, data modeling, DAX and visualization together.
6. Learning Power BI without SQL
For a broader Data Analytics skill set, SQL can complement Power BI, particularly when working with database data.
Power BI vs Excel: What Should Beginners Learn?
Excel and Power BI serve different purposes and can complement each other.
Excel is useful for:
- Spreadsheet analysis
- Calculations
- Small-to-medium data tasks
- Quick analysis
Power BI is useful for:
- Interactive reporting
- Data modeling
- Dashboards
- Business intelligence
- Combining multiple data sources
- Sharing analytical reports
For a student preparing for a Data Analyst career, learning both Excel and Power BI can provide a broader foundation.
Is Power BI Good for a Data Analytics Career?
Power BI can be a valuable skill for people interested in Data Analytics and Business Intelligence.
But Power BI should not be treated as the only skill required for every Data Analyst role.
A broader Data Analytics skill set can include:
Excel + SQL + Power BI + Statistics + Python + Data Analysis
This combination allows you to work across data preparation, analysis, visualization and reporting.
Power BI Training in Indore
Students and working professionals searching for Power BI training in Indore should look beyond simply learning how to create charts.
A practical learning program should cover:
- Power BI Desktop
- Power Query
- Data Cleaning
- Data Transformation
- Data Modeling
- DAX
- Data Visualization
- Dashboard Development
- Real-world Projects
- Data Analytics Applications
GainTech Nexus provides Power BI training for students and working professionals, with practical learning focused on data analysis, dashboards and real-world projects.
You can explore the dedicated Power BI Course at GainTech Nexus to see the training information and curriculum.
Final Power BI Roadmap for Beginners
If you want to remember the entire roadmap in one line:
Don't try to master everything in one day.
Start with the basics, practice with real datasets, build dashboards and gradually move toward advanced Power BI and Data Analytics.
For students in Indore, a structured approach combining Power BI with Excel, SQL, statistics and practical projects can help build a stronger foundation for data analytics roles.
Frequently Asked Questions
What is the Power BI roadmap for beginners?
A beginner-friendly Power BI roadmap starts with data and Excel basics, followed by Power BI Desktop, Power Query, data cleaning, data modeling, DAX, visualization, dashboard development, Power BI Service and real-world projects.
Is Power BI difficult for beginners?
Power BI can be learned by beginners. Starting with data basics and Power BI Desktop before moving into Power Query, data modeling and DAX makes the learning process more structured.
Do I need Python to learn Power BI?
No. Python is not required to start learning Power BI. However, Python can be a useful additional skill for people pursuing broader Data Analytics or Data Science roles.
Do I need SQL for Power BI?
You can start Power BI without SQL, but SQL is an important complementary skill for many Data Analytics workflows, particularly when data comes from relational databases.
Is Power BI useful for Data Analysts?
Power BI is widely used for reporting, visualization and business intelligence. Learning it alongside Excel, SQL, statistics and data-analysis skills can provide a broader Data Analyst toolkit.
Can students in Indore learn Power BI?
Yes. Students can learn Power BI through online or classroom-based learning and practice with real-world datasets and projects. GainTech Nexus offers Power BI training for students and working professionals.